Retrieve a Snow Depth Spiral Centered a Pit
Goal: Visualize a set of snow depths around a pit
Approach:
Retrieve the pit location from the Site Data table
Build a circle around the pit location
Request all the point data inside the circle
Convert to a GeoDataFrame and plot
Process
Step 1: Get the pit/site coordinates
[9]:
from snowexsql.db import get_db
from snowexsql.data import SiteData, PointData
from snowexsql.conversions import points_to_geopandas
import geoalchemy2.functions as gfunc
import geopandas as gpd

# Intense Observation Period Pit Site Identifier
site_id = '5S31'

# Distance around the pit to collect data in meters
buffer_dist = 50

# Connect to the database we made.
db_name = 'db.snowexdata.org/snowex'

engine, session = get_db(db_name, credentials='./credentials.json')

# Grab our pit location by provided site id from the site details table
q = session.query(SiteData).filter(SiteData.site_id == site_id)
sites = q.all()

# There can be different dates at a single site, so we only grab one to retrieve the geometry object
point = session.query(sites[0].geom.ST_AsText()).limit(1).all()
Step 2: Build a buffered circle around our pit
[10]:
# Create a polygon buffered by our distance centered on the pit
q = session.query(gfunc.ST_Buffer(point[0][0], buffer_dist))
buffered_pit = q.all()[0][0]
Step 3: Request all snow depths measured inside the circle
[11]:
# Filter by the dataset type depth
qry = session.query(PointData).filter(PointData.type == 'depth')

# Grab all the point data in the buffer
qry = qry.filter(gfunc.ST_Within(PointData.geom.ST_AsText(), buffered_pit.ST_AsText()))

# Execute the query
points = qry.all()

# Close the session to avoid hanging transactions
session.close()
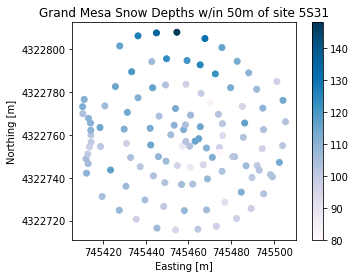
Step 4: Convert the data to Geopandas Dataframe and plot it!
[12]:
# Convert the records received to geopandas
df = points_to_geopandas(points)

# Get the Matplotlib Axes object from the dataframe object, color points by snow depth value
ax = df.plot(column='value', legend=True, cmap='PuBu')

# Use non-scientific notation for x and y ticks
ax.ticklabel_format(style='plain', useOffset=False)

# Set the various plots x/y labels and title.
ax.set_title('Grand Mesa Snow Depths w/in {}m of site {}'.format(buffer_dist, site_id))
ax.set_xlabel('Easting [m]')
ax.set_ylabel('Northing [m]')
[12]:
Text(68.6083306656794, 0.5, 'Northing [m]')